Python | matplotlib.pyplot显示折线图的各种类型设置和用法
程序员文章站
2022-07-15 09:50:35
...
简介
追《乘风破浪的姐姐》上头,越看越生气。
。。。。。。。。。。。。。。。。。。。。。
好了不说与技术无关的话,这里以各个show的排名为例,说明一下plt画图的基本用法。
涉及到的内容有:
- 折线图的画法
- 图示中,中文字符的显示
- 颜色、线型的设置
- 图例的显示,以及位置调整
- 坐标轴范围设置
自行理解和应用。
程序
#-*- coding: utf-8 -*-
import matplotlib.pyplot as plt
name = ['宁静','万茜','张雨绮','张含韵','金晨','郑希怡',
'李斯丹妮','伊能静','王霏霏','蓝盈莹','郁可唯',
'黄龄','黄圣依','白冰']
show1 = [106,131,68, 29, 62, 39,
60, 48,70,63,85,
33, 54, 45]
show2 = [142, 140, 113, 50, 91, 40,
55, 63, 52, 63, 84,
47, 42,39]
show3 = [127, 128,80, 116, 86, 66,
45, 72, 134, 56, 59,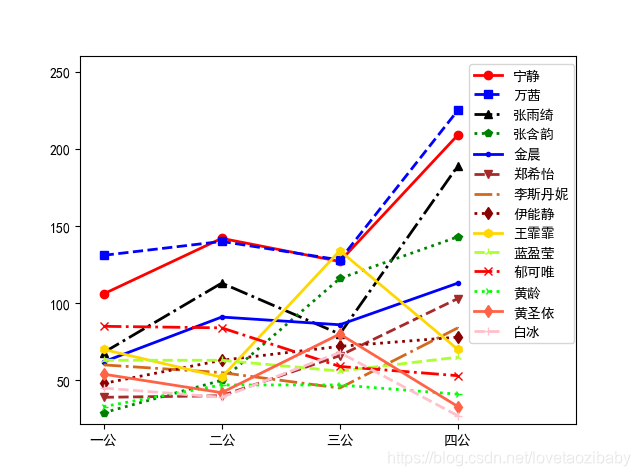
47, 80, 68]
show4 = [209,225,189,143,113,103,
84,78,70,65,53,
41,33,27]
x_data = ['一公','二公','三公','四公']
y_data = []
Color = ['red','blue','black','green','blue','brown',
'chocolate','darkred','gold','greenyellow','red',
'lime','tomato','pink']
markers = ['o', 's', '^', 'p', '.', 'v',
',', 'd', 'h', '2', 'x',
'4','d','+']
Linestyle = ['-','--','-.',':','-','--',
'-.',':','-','--','-.',
':','-','--']
for i in range(len(name)):
y_data.append(show1[i])
y_data.append(show2[i])
y_data.append(show3[i])
y_data.append(show4[i])
# 画图
plt.plot(x_data, y_data, color=Color[i], marker = markers[i], linewidth=2.0, linestyle=Linestyle[i])
# 清零
y_data = []
# 中文显示
plt.rcParams['font.sans-serif']=['SimHei']
plt.rcParams['axes.unicode_minus'] = False
# 图例显示:名称,坐标位置,偏移量
plt.legend(name, loc='lower left', bbox_to_anchor=(0.77, 0.2))
# 坐标轴范围限制
plt.xlim(-0.2,4),plt.ylim(22,260)
plt.show()
结果
PS:
最后说一句无关技术的话。。。。郁可唯实惨!应该是唯一一个参赛姐姐中名次不断的下降下降的吧?
上一篇: 蓝桥杯 二进制数数 算法训练
下一篇: 求一个整数存储在内存中的二进制中1的个数